

The Scheduled Visits graph illustrates the total number of Tasks scheduled for the period that was searched.
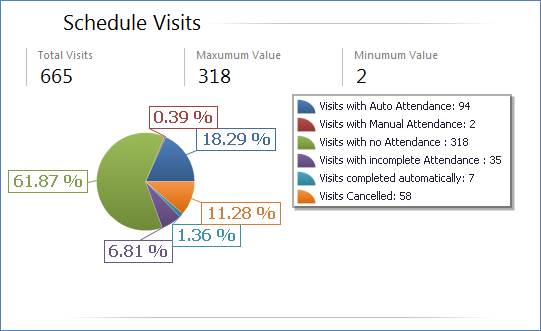
You can see a breakdown of all scheduled Tasks based on attendance status.
You can see the total number of Tasks where a Carer’s attendance was marked automatically; where a Carer’s attendance was marked manually by an InnovaCare User; where there was no attendance; where attendance is ongoing (i.e. incomplete); where Tasks were completed automatically; and where Tasks were cancelled.
At the top of the graph, you can view the total number of Tasks, as well as the maximum and minimum values.
The graph also allows you to view the various attendance types as percentages of the Total Tasks.