

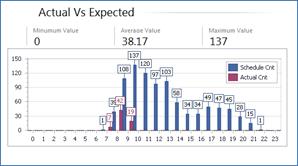
 This graph illustrates both the number of
calls actually received for the period that was searched, and the
number of calls expected. The X Axis illustrates the call count
and the Y Axis illustrates at what time of the day these calls were
received/expected to be received. Actual calls are rendered in red; expected
calls are rendered in blue.
This graph illustrates both the number of
calls actually received for the period that was searched, and the
number of calls expected. The X Axis illustrates the call count
and the Y Axis illustrates at what time of the day these calls were
received/expected to be received. Actual calls are rendered in red; expected
calls are rendered in blue.
In the above screen shot we can see that at 7am, seven calls were received, but 39 were expected. At 8am, 42 calls were received and 108 calls were expected, and finally at 9am, 19 calls were received and 137 calls were expected.
The graph also illustrates the minimum, maximum and average number of calls expected for the period searched.