

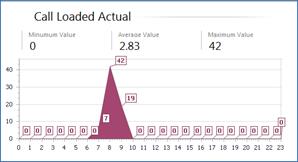
 This graph illustrates the overall number
of calls actually received for the period that was searched. The
X Axis illustrates the call count and the Y Axis illustrates at what time of
the day these calls were received.
This graph illustrates the overall number
of calls actually received for the period that was searched. The
X Axis illustrates the call count and the Y Axis illustrates at what time of
the day these calls were received.
In the above screenshot we can see the total number of calls received so far on a given day. At 7am, seven calls were received. At 8am, 42 calls were received, and at 9am, 19 calls were received.
As this graph only illustrates Actual Calls received, it does not give any indication of the number of calls expected for this period.
The graph also illustrates the minimum, maximum and average number of calls (per hour) received for the period searched.